
Step 01Week 1
Send Us Your Budget
Send your adopted budget and current reports — any format your accounting system produces. We load them and set up the dashboard in your city’s brand.
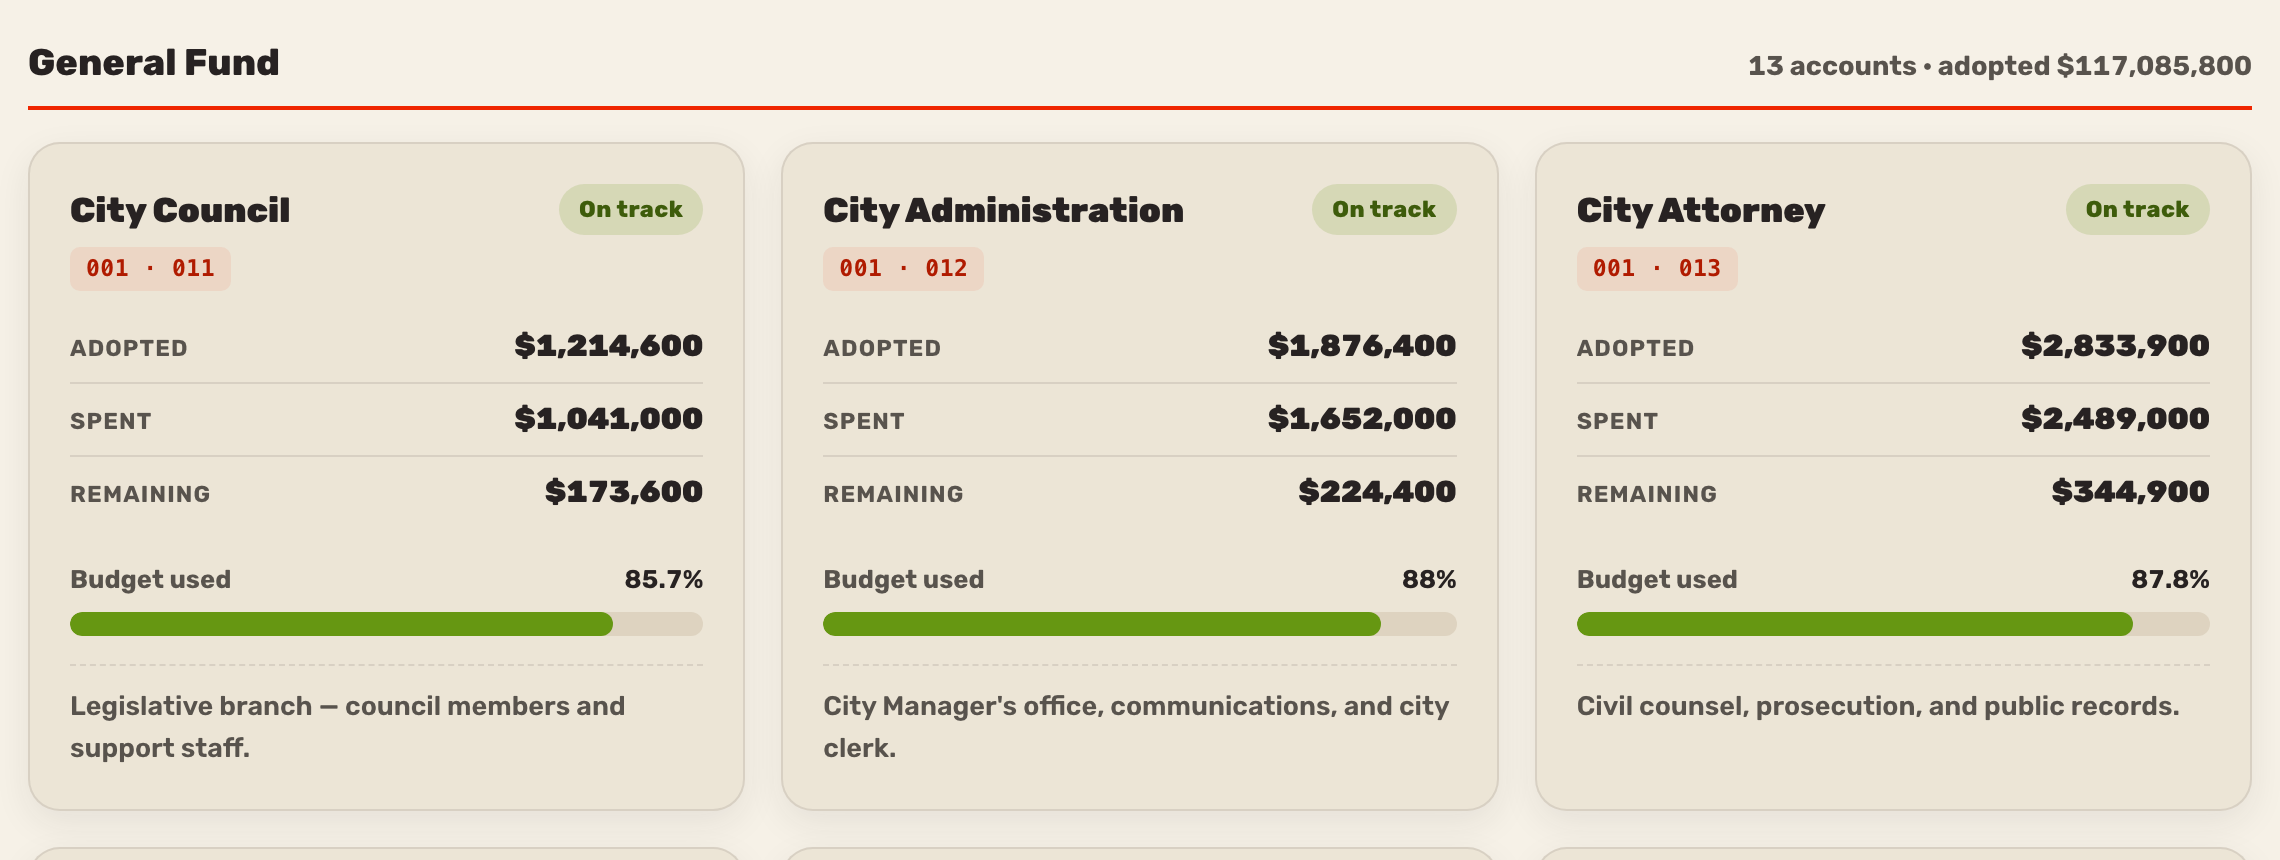
CivicLens turns your adopted budget into a clear, accessible public dashboard — fund by fund, with revenue and multi-year trends. Your finance team keeps it current in minutes a month, or we can do it for you.

Why CivicLens
Enterprise transparency suites are built and priced for big cities — thousands to tens of thousands a year, and months to roll out. The alternative most small towns settle for is a budget PDF nobody reads. CivicLens is the middle: professional, maintained, and priced for a town your size.
Each month, upload the reports your accounting system already exports — any format, no reformatting — review the draft, and publish. Rather not? Add managed updates and we post them for you.
From $3,600 a year, scaled to your population — well under the enterprise suites, which run $5,000 to $50,000+ a year. No RFP, no implementation project, no per-seat licensing.
Send your adopted budget and we set it up in your colors and logo. Most communities go live in two to three weeks — not the multi-month rollout the big platforms require.
How it works
Send your adopted budget and current reports — any format your accounting system produces. We load them and set up the dashboard in your city’s brand.
Each month, staff upload the same reports, review the draft, and publish. Prefer to hand it off? Add managed updates and we post them for you.
A clear, searchable, accessible public site with multi-year trends — the budget story residents can actually read.
The honest comparison
Most small and mid-size cities are stuck choosing between a platform they can’t afford and a PDF that doesn’t help anyone. There’s a better middle.
$5,000 to $50,000+ a year, RFPs, and multi-month implementations. Built for big cities with IT teams and dedicated budgeting staff — not a town of 12,000.
Free, but static, unsearchable, and unreadable. It checks a box; it doesn’t answer a resident’s question or build any trust.
The clarity of the enterprise tools, simple for your staff to keep current, priced for communities up to 50,000 — and live in weeks. Professional transparency without the price tag or the project.
Features
Screen-reader data tables behind every chart, keyboard navigation, and WCAG 2.1 AA / Section 508 alignment — the boxes your ADA coordinator and procurement office check.
A budget website/dashboard is a scored criterion in GFOA's 2026 Distinguished Budget Award — and accessibility is scored too. CivicLens is built to support your submission.
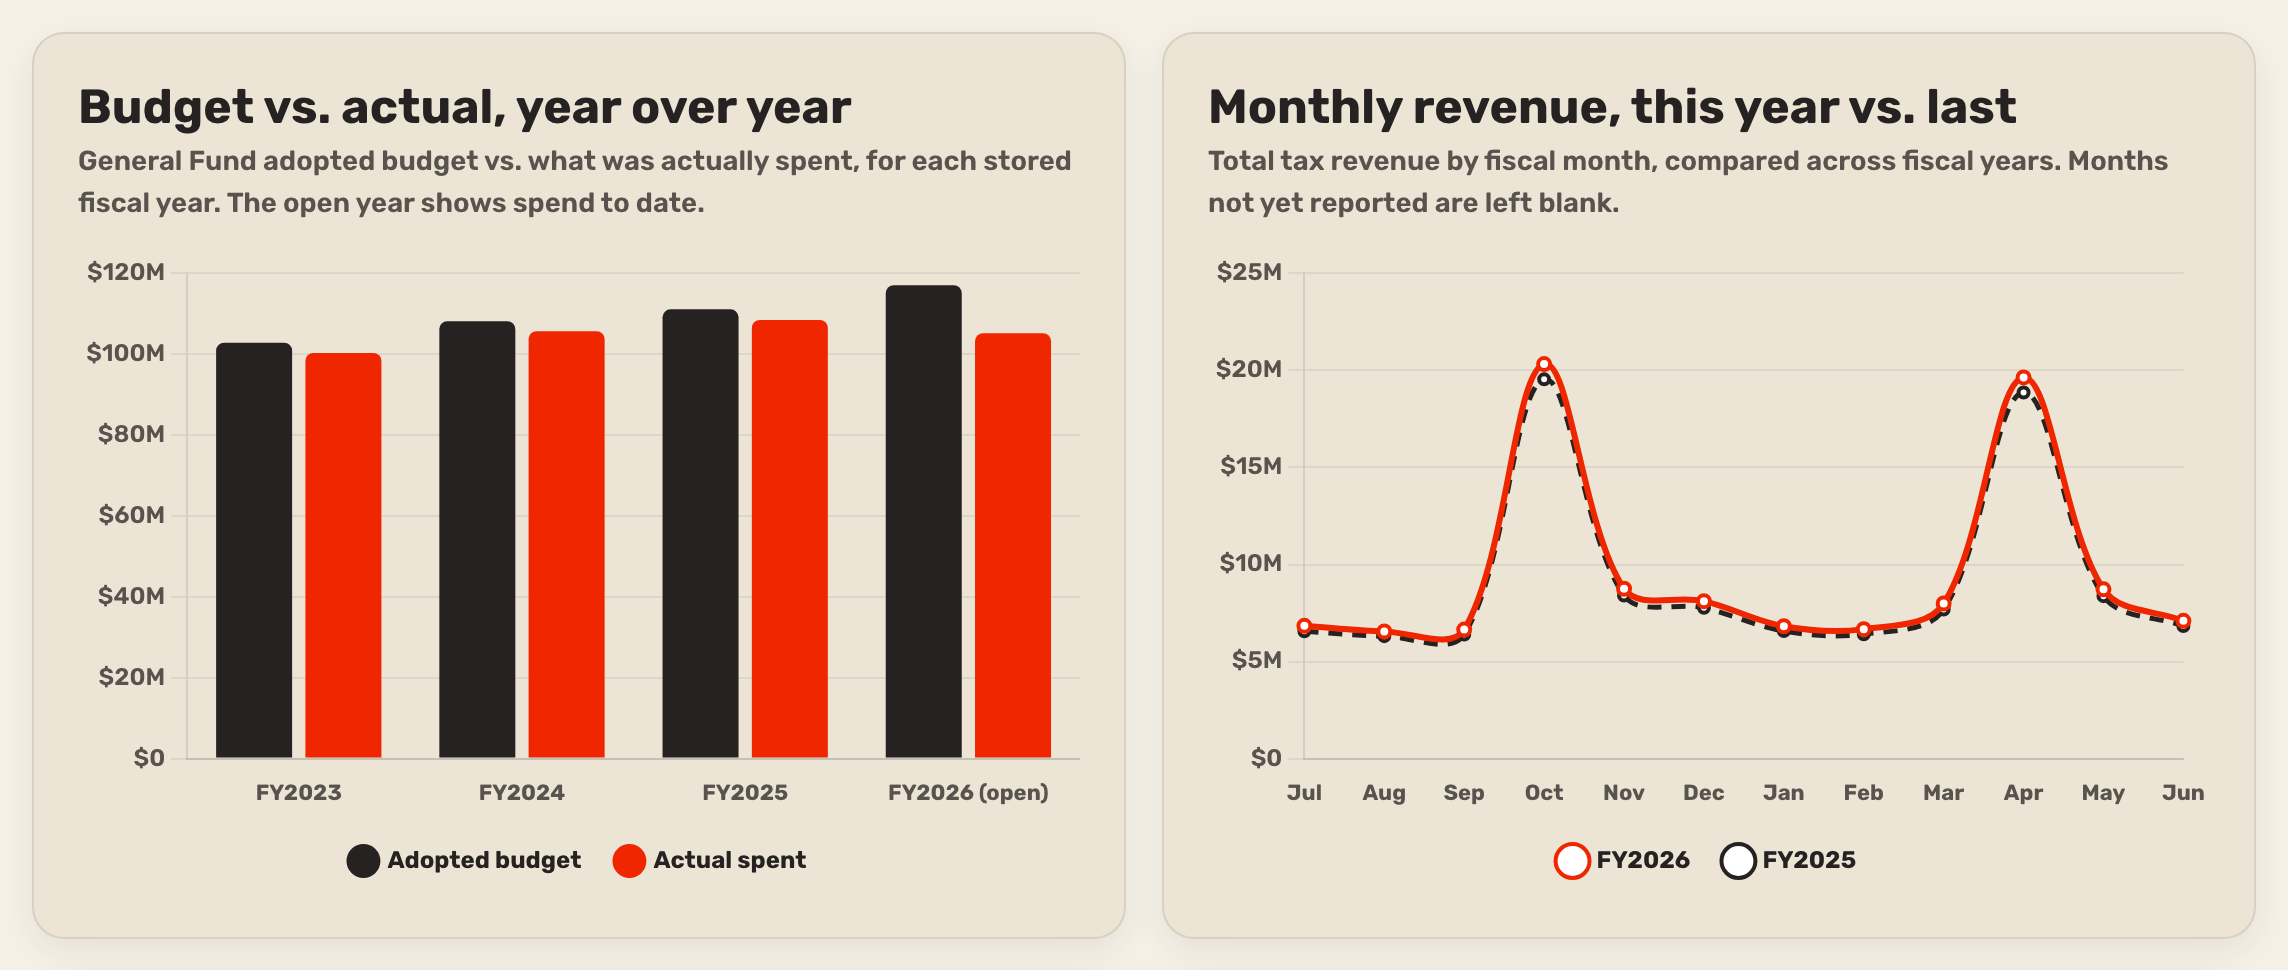
Year-over-year and month-over-month trends across four fiscal years, so residents can see how spending and revenue are actually moving.
Your funds, your account numbers, your revenue types (sales, property, licenses, fines, charges for services — whatever you track), your brand. Matched to your adopted budget, not a rigid template.
No CMS, no accounting-system integration, no heavy IT lift. Host it on a finance.yourcity.gov subdomain and link it from your site.
A change-history audit trail, public-read / staff-write security, and nondestructive updates — so the numbers residents see are dependable.
Built with a real borough
CivicLens grew out of a transparency dashboard built for an Alaska borough. It’s the story a small city wants to tell its residents: responsible with public money, and open about it — without hiring a vendor the size of the city.
Book a 20-minute call — we’ll load a sample of your numbers, walk the live dashboard, and quote a fixed setup. Your staff keep it current in minutes a month; your community gets the credit.